|
Summary
|
|
|
|
Fund Name
|
DSP Mutual Fund
|
|
Scheme Name
|
DSP India T.I.G.E.R Fund-Reg(IDCW)
|
|
AMC
|
DSP Investment Managers Private Limited
|
|
Type
|
Open ended scheme
|
|
Category
|
Equity - Sectoral Fund - Infrastructure
|
|
Launch Date |
11-Jun-04
|
|
Fund Manager
|
Rohit Singhania , Charanjit Singh , Jay Kothari
|
|
Face Value
|
10
|
|
Custodian |
Citibank N.A
|
|
Net Assets (Rs. cr)
|
3363.58
|
|
|
|
|
|
AMC Details |
|
DSP Investment Managers Private Limited
|
|
Mafatlal Centre,
|
|
10th Floor, Nariman Point,
|
|
Mumbai - 400 021
|
|
Phone :
+91 (22) 66578000
|
|
Fax :
+91 (22) 66578181
|
|
service@dspblackrock.com
|
|
https://www.dspim.com/
|
|
|
|
Registrar & Transfer Agent Details |
|
Computer Age Management Services Limited
|
|
178 / 10, Kodambakkam High Road,
|
|
Opp. Palmgroove Hotel, M.G.R. Salai, Nungambakkam,
|
|
Chennai - 600 034
|
|
(044) 39115574, 39115583
|
|
(044) 28291521
|
|
camslb@camsonline.com
|
|
www.camsonline.com
|
|
|
|
|
|
|
|
|
NAV Details
|
|
|
|
|
|
NAV Date
|
24-Apr-24 |
Max Entry Load %
|
0.00 |
|
NAV [Rs] |
29.33 |
Max Exit Load %
|
1.00 |
|
Buy/Resale Price [Rs]
|
29.33 |
52 Week High[Rs] |
29.33 (24-Apr-24) |
|
Sell/Repurchase Price [Rs]
|
29.33 |
52 Week Low[Rs]
|
18.39 (26-Apr-23) |
| 1% before 12M, Nil on or after 12M |
|
|
|
|
|
Nav Graph |
|
|
|
|
|
|
|
|
|
|
|
|
Dividend Details
|
|
Record
|
Record
|
Divedend Per Unit(Rs.)
|
Bonus |
Ex.Div |
Ex.Div |
|
Date
|
NAV(Rs)
|
Indivisual/HUF |
Others
|
Ratio |
Date |
NAV(Rs) |
|
08-Feb-2024
|
28.764
|
2.3
|
2.3 |
- |
09-Feb-2024
|
26.265 |
|
09-Feb-2023
|
19.605
|
1.6
|
1.6 |
- |
10-Feb-2023
|
18.101 |
|
10-Feb-2022
|
19.462
|
2
|
2 |
- |
11-Feb-2022
|
17.154 |
|
11-Feb-2021
|
16.278
|
1.590000033
|
1.590000033 |
- |
12-Feb-2021
|
14.661 |
|
06-Feb-2020
|
15.902
|
1.58
|
1.58 |
- |
07-Feb-2020
|
14.116 |
|
|
|
|
|
|
|
Investment Details
|
|
Objective |
| An open ended diversified equity scheme, seeking to generate capital appreciation, from a portfolio that is substantially constituted of equity securities and equity related securities of corporates, which could benefit from structural changes brought about by continuing liberalization in economic policies by the Government and/ or from continuing investments in infrastructure, both by the public and private sector. |
|
|
|
|
|
Min. Investment(Rs.)
|
100 |
|
Increm.Investment(Rs.)
|
100 |
|
|
|
Investment Pattern |
| Type | Minimum % | Maximum % | | Eq and eq related sec of Comp whose fundamentals & future growth could be influenced by the ongoing process of economic reforms and/or Infra development theme | 80 | 100 | | Equity and Equity related securities of other Companies | 0 | 20 | | Debt, securitized debt and MMI | 0 | 20 | | Units issued by REITs & InvITs | 0 | 10 |
|
|
|
|
|
SIP Details |
|
|
|
SIP MIN Investments(Rs.) |
|
|
SIP Incremental Investments(Rs.) |
|
|
SIP Frequency |
Daily |
|
No.of Investments Cheques
|
|
|
|
|
|
|
|
Ratio
|
| |
|
Statistical Ratios |
|
|
|
|
Standard Deviation [%] |
16.5239
|
|
Semi Standard Deviation [%] |
0.3622
|
|
Beta [%] |
0.7860
|
|
Sharpe Ratio [%] |
1.3039
|
|
R-Square [%] |
0.5720
|
|
Expense Ratio [%] |
1.9900
|
|
AVG Ratio [%] |
0.0911
|
|
|
|
|
Other Ratios |
|
|
|
|
Jenson Ratio [%] |
0.1579
|
|
Treynor Ratio [%] |
0.2811
|
|
Turnover Ratio [%] |
0.0000
|
|
FAMA Ratio [%] |
0.1482
|
|
SORTINO Ratio [%] |
0.2214
|
|
|
|

|
What is Standard Deviation?
Standard Deviation is the measure of the deviation in the returns of the portfolio. In Simple Words it tells us how much the return on the fund is deviating from the expected normal return.
|
|
|
What is Jenson's Alpha?
It measures whether the Scheme is generating excess returns over the normal returns.For example, if there are two mutual funds that both have a 12% return, a rational investor will want the fund that is less risky.If the value is positive, then the portfolio is earning excess returns. In other words, a positive value for Jensen's alpha means a fund manager has 'beat the market' w with his or her stock picking skills. The Higher the value the better the performance.
|
|
|
|
|
|
|
Portfolio Analysis
|
|
|
|
Allocations As on
31-Mar-2024
|
|
|
|
Fund Size :
3363.58
(Cr.) |
|
|
|
 |
|
 |
|
|
|
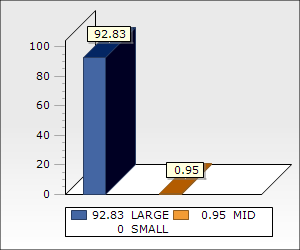
Market cap-wise Allocation Style |
|
|
|
Average Mkt Cap (Rs Cr) |
106866.97
|
|
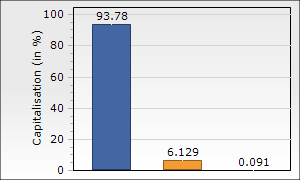
Market Capitalization |
% of Portfolio
|
|
Large |
92.83
|
|
Mid |
0.95
|
|
Small |
NA
|
|
Note: Large-Cap = 5000 Crs. and above, Mid-Cap = 2000 Crs. to 5000 Crs. and
Small-Cap = less than 2000 Crs. |
|
|
|
|
|
|
Portfolio Concentration |
|
|
% Net Assets
|
|
Top 3 Sectors |
30.72 |
|
|
|
+ - Top 5 Holdings |
21.44 |
| Tri-Party Repo (TREP | 6.18 | | NTPC | 3.99 | | Larsen & Toubro | 3.82 | | Siemens | 3.75 | | Kirloskar Oil Eng | 3.70 |
|
|
+ - Top 10 Holdings |
36.17 |
| Tri-Party Repo (TREP | 6.18 | | NTPC | 3.99 | | Larsen & Toubro | 3.82 | | Siemens | 3.75 | | Kirloskar Oil Eng | 3.70 | | Apar Inds | 3.27 | | Hindustan Aeron | 3.17 | | Kalpataru Projects | 3.04 | | Reliance Industries | 3.00 | | Polycab India | 2.25 |
|
|
|
|
|
 Tri-Party Repo (TREPS)
|
6.18
|
|
NTPC Ltd.
|
3.99
|
|
Larsen & Toubro Ltd.
|
3.82
|
|
Siemens Ltd.
|
3.75
|
 Kirloskar Oil Engines Ltd.
|
3.70
|
|
Apar Industries Ltd.
|
3.27
|
|
Hindustan Aeronautics Ltd.
|
3.17
|
|
Kalpataru Projects International Ltd.
|
3.04
|
|
Reliance Industries Ltd.
|
3.00
|
|
Polycab India Ltd.
|
2.25
|
|
|
  Indicates an increase or decrease or no change in holding since last portfolio
|
 Indicates a new holding since last portfolio. Indicates a new holding since last portfolio. |
 |
|
|
|
|
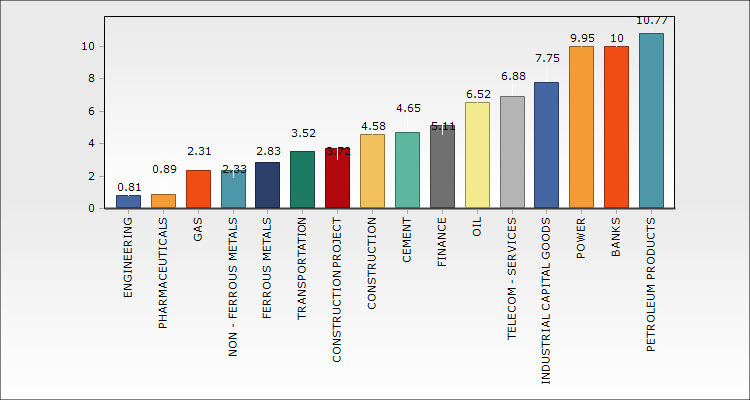
Sector Allocation * (as % of equity portfolio) |
|
|
|
Sector Allocation
Chart Type : |
 |
|
*Pertains to the equity investments only. |
|
|
|
|
|
|
|
|
|
|
In / Out
|
| |
| What's in as on 31-Mar-2024 |
|
What's out as on 31-Mar-2024 |
| Company Name | Mkt Value | Holdings | | (Rs.Cr) | % | | Oil & Natural Gas Corporation Ltd. | 33.7333 | 1.0029 |
|
|
| Company Name | Mkt Value | Holdings | | (Rs.Cr) | % |
|
|
|
|
|
|
|
