|
Summary
|
|
|
|
Fund Name
|
Aditya Birla Sun Life Mutual Fund
|
|
Scheme Name
|
Aditya Birla SL India GenNext Fund(IDCW-Reinv)-Direct Plan
|
|
AMC
|
Aditya Birla Sun Life AMC Limited
|
|
Type
|
Open ended scheme
|
|
Category
|
Equity - Sectoral Fund - Consumption
|
|
Launch Date |
01-Jan-13
|
|
Fund Manager
|
Chanchal Khandelwal
|
|
Face Value
|
10
|
|
Custodian |
Citibank N.A
|
|
Net Assets (Rs. cr)
|
4796.85
|
|
|
|
|
|
AMC Details |
|
Aditya Birla Sun Life AMC Limited
|
|
One World Center , Tower 1, 17th Floor, Jupiter Mill Compound,
|
|
Senapati Bapat Marg, Elphinstone Road,
|
|
Mumbai - 400 013
|
|
Phone :
022-43568000
|
|
Fax :
022-43568110/ 8111
|
|
care.mutualfunds@adityabirlacapital.com
|
|
https://mutualfund.adityabirlacapital.com/
|
|
|
|
Registrar & Transfer Agent Details |
|
Computer Age Management Services Limited
|
|
178 / 10, Kodambakkam High Road,
|
|
Opp. Palmgroove Hotel, M.G.R. Salai, Nungambakkam,
|
|
Chennai - 600 034
|
|
(044) 39115574, 39115583
|
|
(044) 28291521
|
|
camslb@camsonline.com
|
|
www.camsonline.com
|
|
|
|
|
|
|
|
|
NAV Details
|
|
|
|
|
|
NAV Date
|
25-Apr-24 |
Max Entry Load %
|
0.00 |
|
NAV [Rs] |
50.47 |
Max Exit Load %
|
1.00 |
|
Buy/Resale Price [Rs]
|
50.47 |
52 Week High[Rs] |
50.47 (25-Apr-24) |
|
Sell/Repurchase Price [Rs]
|
50.47 |
52 Week Low[Rs]
|
39.16 (26-May-23) |
| 1% on or before 30D, Nil after 30D |
|
|
|
|
|
Nav Graph |
|
|
|
|
|
|
|
|
|
|
|
|
Dividend Details
|
|
Record
|
Record
|
Divedend Per Unit(Rs.)
|
Bonus |
Ex.Div |
Ex.Div |
|
Date
|
NAV(Rs)
|
Indivisual/HUF |
Others
|
Ratio |
Date |
NAV(Rs) |
|
25-May-2023
|
41.47
|
2.672
|
2.672 |
- |
26-May-2023
|
39.16 |
|
25-May-2022
|
36.94
|
2.243
|
2.243 |
- |
26-May-2022
|
35.06 |
|
25-May-2021
|
35.81
|
1.889999986
|
1.889999986 |
- |
26-May-2021
|
34.15 |
|
26-May-2020
|
23.28
|
1.35
|
1.35 |
- |
27-May-2020
|
22.26 |
|
29-May-2019
|
29.01
|
2.02758551
|
2.02758551 |
- |
30-May-2019
|
26.87 |
|
|
|
|
|
|
|
Investment Details
|
|
Objective |
| An open-ended growth scheme with the objective to target growth of capital by investing in equity/equity related instruments of companies that are expected to benefit from the rising consumption patterns in India, which in turn is getting fuelled by high disposable incomes of the young generation (Generation Next). The scheme will invest in companies that have the following characteristics as Companies that seek growth in revenues arising out of demand from the younger generation (GenNext) for their products or services,they should be engaged in manufacturing of products or rendering of services that go directly to the consumer, the products and services should have distinct brand identity, thereby enabling choice. |
|
|
|
|
|
Min. Investment(Rs.)
|
1000 |
|
Increm.Investment(Rs.)
|
1000 |
|
|
|
Investment Pattern |
| Type | Minimum % | Maximum % | | Equity | 80 | 100 | | MMI | 0 | 20 | | Others | 0 | 20 | | Debt | 0 | 20 |
|
|
|
|
|
SIP Details |
|
|
|
SIP MIN Investments(Rs.) |
|
|
SIP Incremental Investments(Rs.) |
|
|
SIP Frequency |
Daily |
|
No.of Investments Cheques
|
|
|
|
|
|
|
|
Ratio
|
| |
|
Statistical Ratios |
|
|
|
|
Standard Deviation [%] |
10.6873
|
|
Semi Standard Deviation [%] |
0.3622
|
|
Beta [%] |
0.7246
|
|
Sharpe Ratio [%] |
1.0504
|
|
R-Square [%] |
0.8153
|
|
Expense Ratio [%] |
0.7600
|
|
AVG Ratio [%] |
0.0911
|
|
|
|
|
Other Ratios |
|
|
|
|
Jenson Ratio [%] |
0.0596
|
|
Treynor Ratio [%] |
0.1624
|
|
Turnover Ratio [%] |
0.0000
|
|
FAMA Ratio [%] |
0.0744
|
|
SORTINO Ratio [%] |
0.2214
|
|
|
|

|
What is Standard Deviation?
Standard Deviation is the measure of the deviation in the returns of the portfolio. In Simple Words it tells us how much the return on the fund is deviating from the expected normal return.
|
|
|
What is Jenson's Alpha?
It measures whether the Scheme is generating excess returns over the normal returns.For example, if there are two mutual funds that both have a 12% return, a rational investor will want the fund that is less risky.If the value is positive, then the portfolio is earning excess returns. In other words, a positive value for Jensen's alpha means a fund manager has 'beat the market' w with his or her stock picking skills. The Higher the value the better the performance.
|
|
|
|
|
|
|
Portfolio Analysis
|
|
|
|
Allocations As on
31-Mar-2024
|
|
|
|
Fund Size :
4796.85
(Cr.) |
|
|
|
 |
|
 |
|
|
|
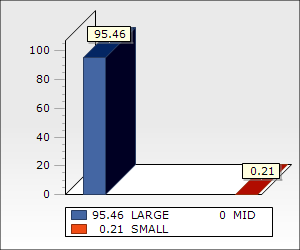
Market cap-wise Allocation Style |
|
|
|
Average Mkt Cap (Rs Cr) |
146188.44
|
|
Market Capitalization |
% of Portfolio
|
|
Large |
95.46
|
|
Mid |
NA
|
|
Small |
0.21
|
|
Note: Large-Cap = 5000 Crs. and above, Mid-Cap = 2000 Crs. to 5000 Crs. and
Small-Cap = less than 2000 Crs. |
|
|
|
|
|
|
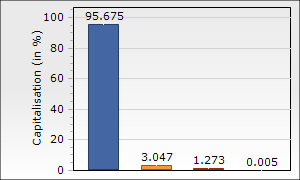
Portfolio Concentration |
|
|
% Net Assets
|
|
Top 3 Sectors |
45.99 |
|
|
|
+ - Top 5 Holdings |
21.45 |
| ITC | 5.02 | | ICICI Bank | 4.99 | | Bharti Airtel | 4.30 | | HDFC Bank | 3.79 | | Maruti Suzuki | 3.35 |
|
|
+ - Top 10 Holdings |
35.55 |
| ITC | 5.02 | | ICICI Bank | 4.99 | | Bharti Airtel | 4.30 | | HDFC Bank | 3.79 | | Maruti Suzuki | 3.35 | | Tata Motors - DVR | 3.05 | | Avenue Supermarts | 3.02 | | Trent | 2.90 | | Hindustan Unilever | 2.67 | | TVS Motor | 2.46 |
|
|
|
|
|
 ITC Ltd.
|
5.02
|
|
ICICI Bank Ltd.
|
4.99
|
|
Bharti Airtel Ltd.
|
4.30
|
|
HDFC Bank Ltd.
|
3.79
|
|
Maruti Suzuki India Ltd.
|
3.35
|
 Tata Motors Ltd. - DVR Ordinary
|
3.05
|
|
Avenue Supermarts Ltd.
|
3.02
|
|
Trent Ltd.
|
2.90
|
|
Hindustan Unilever Ltd.
|
2.67
|
|
TVS Motor Company Ltd.
|
2.46
|
|
|
  Indicates an increase or decrease or no change in holding since last portfolio
|
 Indicates a new holding since last portfolio. Indicates a new holding since last portfolio. |
 |
|
|
|
|
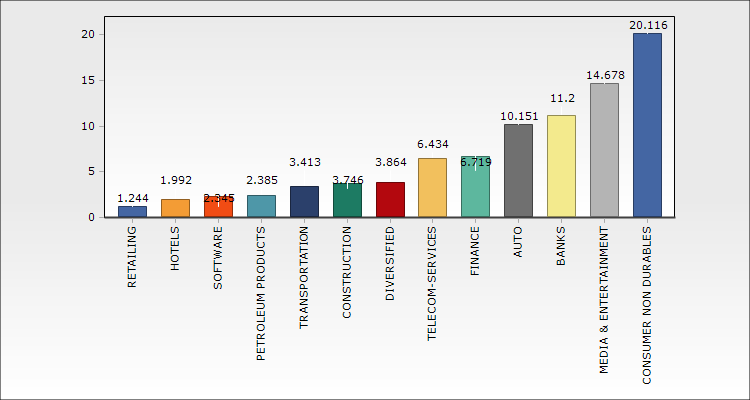
Sector Allocation * (as % of equity portfolio) |
|
|
|
Sector Allocation
Chart Type : |
 |
|
*Pertains to the equity investments only. |
|
|
|
|
|
|
|
|
|
|
In / Out
|
| |
| What's in as on |
|
What's out as on |
| Company Name | Mkt Value | Holdings | | (Rs.Cr) | % | | No Data Found |
|
|
| Company Name | Mkt Value | Holdings | | (Rs.Cr) | % | | No Data Found |
|
|
|
|
|
|
|
