|
Summary
|
|
|
|
Fund Name
|
Bandhan Mutual Fund
|
|
Scheme Name
|
Bandhan Liquid Fund-Reg(DD-IDCW)
|
|
AMC
|
Bandhan AMC Limited
|
|
Type
|
Open ended scheme
|
|
Category
|
Debt - Liquid Fund
|
|
Launch Date |
02-Apr-04
|
|
Fund Manager
|
Harshal Joshi , Brijesh Shah
|
|
Face Value
|
10
|
|
Custodian |
Deutsche Bank A.G.
|
|
Net Assets (Rs. cr)
|
10444.18
|
|
|
|
|
|
AMC Details |
|
Bandhan AMC Limited
|
|
OneIndiaBulls Centre, 841, Jupiter Mills Compound,
|
|
Senapati Bapat Marg, Elphinstone Road (West),
|
|
Mumbai - 400 013
|
|
Phone :
022-66289999
|
|
Fax :
022-24215052
|
|
investormf@bandhanamc.com
|
|
https://bandhanmutual.com/
|
|
|
|
Registrar & Transfer Agent Details |
|
Computer Age Management Services Limited
|
|
178 / 10, Kodambakkam High Road,
|
|
Opp. Palmgroove Hotel, M.G.R. Salai, Nungambakkam,
|
|
Chennai - 600 034
|
|
(044) 39115574, 39115583
|
|
(044) 28291521
|
|
camslb@camsonline.com
|
|
www.camsonline.com
|
|
|
|
|
|
|
|
|
NAV Details
|
|
|
|
|
|
NAV Date
|
18-Apr-24 |
Max Entry Load %
|
0.00 |
|
NAV [Rs] |
1001.08 |
Max Exit Load %
|
0.01 |
|
Buy/Resale Price [Rs]
|
1001.08 |
52 Week High[Rs] |
1001.67 (31-Mar-24) |
|
Sell/Repurchase Price [Rs]
|
1001.08 |
52 Week Low[Rs]
|
1001.08 (21-Apr-23) |
| 0.007% for Day 1, 0.0065% on Day 2, 0.0060% on Day 3, 0.0055% on Day 4, 0.0050% on Day 5, 0.0045% on Day 6, NIL after 7D |
|
|
|
|
|
Nav Graph |
|
|
|
|
|
|
|
|
|
|
|
|
Dividend Details
|
|
Record
|
Record
|
Divedend Per Unit(Rs.)
|
Bonus |
Ex.Div |
Ex.Div |
|
Date
|
NAV(Rs)
|
Indivisual/HUF |
Others
|
Ratio |
Date |
NAV(Rs) |
|
18-Apr-2024
|
1001.0846
|
0.17652546
|
0.17652546 |
- |
18-Apr-2024
|
1001.0846 |
|
17-Apr-2024
|
1001.0846
|
0.18277352
|
0.18277352 |
- |
17-Apr-2024
|
1001.0846 |
|
16-Apr-2024
|
1001.0846
|
0.19983701
|
0.19983701 |
- |
16-Apr-2024
|
1001.0846 |
|
15-Apr-2024
|
1001.0846
|
0.21175963
|
0.21175963 |
- |
15-Apr-2024
|
1001.0846 |
|
14-Apr-2024
|
1001.0846
|
0.36890463
|
0.36890463 |
- |
14-Apr-2024
|
1001.0846 |
|
|
|
|
|
|
|
Investment Details
|
|
Objective |
| The Scheme seeks to offer an investment avenue for short term savings by looking to generate returns commensurate with a low risk strategy and with high liquidity, from a portfolio that is invested in debt and money market securities with maturity up to 91 days. |
|
|
|
|
|
Min. Investment(Rs.)
|
100 |
|
Increm.Investment(Rs.)
|
100 |
|
|
|
Investment Pattern |
| Type | Minimum % | Maximum % | | Debt Securities (including G-Sec and securitised debt) and MMI with maturity upto 91D | 0 | 100 |
|
|
|
|
|
SIP Details |
|
|
|
SIP MIN Investments(Rs.) |
|
|
SIP Incremental Investments(Rs.) |
|
|
SIP Frequency |
Monthly |
|
No.of Investments Cheques
|
|
|
|
|
|
|
|
Ratio
|
| |
|
Statistical Ratios |
|
|
|
|
Standard Deviation [%] |
0.0860
|
|
Semi Standard Deviation [%] |
0.1196
|
|
Beta [%] |
-0.0003
|
|
Sharpe Ratio [%] |
3.0959
|
|
R-Square [%] |
-0.0115
|
|
Expense Ratio [%] |
0.2500
|
|
AVG Ratio [%] |
0.0195
|
|
|
|
|
Other Ratios |
|
|
|
|
Jenson Ratio [%] |
0.0081
|
|
Treynor Ratio [%] |
-28.2585
|
|
Turnover Ratio [%] |
0.0000
|
|
FAMA Ratio [%] |
0.0077
|
|
SORTINO Ratio [%] |
0.0718
|
|
|
|

|
What is Standard Deviation?
Standard Deviation is the measure of the deviation in the returns of the portfolio. In Simple Words it tells us how much the return on the fund is deviating from the expected normal return.
|
|
|
What is Jenson's Alpha?
It measures whether the Scheme is generating excess returns over the normal returns.For example, if there are two mutual funds that both have a 12% return, a rational investor will want the fund that is less risky.If the value is positive, then the portfolio is earning excess returns. In other words, a positive value for Jensen's alpha means a fund manager has 'beat the market' w with his or her stock picking skills. The Higher the value the better the performance.
|
|
|
|
|
|
|
Portfolio Analysis
|
|
|
|
Allocations As on
31-Mar-2024
|
|
|
|
Fund Size :
10444.18
(Cr.) |
|
|
|
 |
|
 |
|
|
|
Market cap-wise Allocation Style |
|
|
|
Average Mkt Cap (Rs Cr) |
NA
|
|
Market Capitalization |
% of Portfolio
|
|
Large |
NA
|
|
Mid |
NA
|
|
Small |
NA
|
|
Note: Large-Cap = 5000 Crs. and above, Mid-Cap = 2000 Crs. to 5000 Crs. and
Small-Cap = less than 2000 Crs. |
|
|
|
|
|
|
Portfolio Concentration |
|
|
% Net Assets
|
|
Top 3 Sectors |
NA |
|
|
|
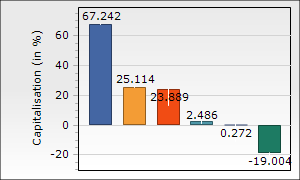
+ - Top 5 Holdings |
41.66 |
| Tri-Party Repo (TREP | 4.80 | | Corporate Debt Mkt. | 0.27 | | Cash & Cash Equivalent | 0.00 | | Net Current Asset | -23.80 |
|
|
+ - Top 10 Holdings |
66.82 |
| Tri-Party Repo (TREP | 4.80 | | Corporate Debt Mkt. | 0.27 | | Cash & Cash Equivalent | 0.00 | | Net Current Asset | -23.80 |
|
|
|
|
|
 91 Days Tbill
|
9.46
|
|
Small Industries Dev Bank of India **
|
9.45
|
 91 Days Tbill
|
9.03
|
|
Export Import Bank of India **
|
7.09
|
|
National Bank For Agriculture and Rural Development **
|
6.63
|
|
Canara Bank **
|
6.62
|
 Tri-Party Repo (TREPS)
|
4.80
|
|
Tata Capital Limited **
|
4.75
|
|
Reliance Retail Ventures Limited **
|
4.74
|
|
Canara Bank **
|
4.25
|
|
|
  Indicates an increase or decrease or no change in holding since last portfolio
|
| Indicates a new holding since last portfolio. |
 |
|
|
|
|
Sector Allocation * (as % of equity portfolio) |
|
|
|
Sector Allocation
Chart Type : |
 |
|
*Pertains to the equity investments only. |
|
|
|
|
|
|
|
|
|
|
In / Out
|
| |
| What's in as on |
|
What's out as on |
| Company Name | Mkt Value | Holdings | | (Rs.Cr) | % | | No Data Found |
|
|
| Company Name | Mkt Value | Holdings | | (Rs.Cr) | % | | No Data Found |
|
|
|
|
|
|
|
