|
|
|
|
|
|
|
|
|
|
|
|
|
DSP Natural Res & New Energy Fund-Reg(G)
|
|
|
|
Summary
|
|
|
|
Fund Name
|
DSP Mutual Fund
|
|
Scheme Name
|
DSP Natural Res & New Energy Fund-Reg(G)
|
|
AMC
|
DSP Investment Managers Private Limited
|
|
Type
|
Open ended scheme
|
|
Category
|
Equity - Sectoral Fund - Energy & Power
|
|
Launch Date |
25-Apr-08
|
|
Fund Manager
|
Rohit Singhania , Jay Kothari
|
|
Face Value
|
10
|
|
Custodian |
Citibank N.A
|
|
Net Assets (Rs. cr)
|
990.34
|
|
|
|
|
|
AMC Details |
|
DSP Investment Managers Private Limited
|
|
Mafatlal Centre,
|
|
10th Floor, Nariman Point,
|
|
Mumbai - 400 021
|
|
Phone :
+91 (22) 66578000
|
|
Fax :
+91 (22) 66578181
|
|
service@dspblackrock.com
|
|
https://www.dspim.com/
|
|
|
|
Registrar & Transfer Agent Details |
|
Computer Age Management Services Limited
|
|
178 / 10, Kodambakkam High Road,
|
|
Opp. Palmgroove Hotel, M.G.R. Salai, Nungambakkam,
|
|
Chennai - 600 034
|
|
(044) 39115574, 39115583
|
|
(044) 28291521
|
|
camslb@camsonline.com
|
|
www.camsonline.com
|
|
|
|
|
|
|
|
|
NAV Details
|
|
|
|
|
|
NAV Date
|
03-May-24 |
Max Entry Load %
|
0.00 |
|
NAV [Rs] |
89.20 |
Max Exit Load %
|
0.00 |
|
Buy/Resale Price [Rs]
|
89.20 |
52 Week High[Rs] |
89.20 (03-May-24) |
|
Sell/Repurchase Price [Rs]
|
89.20 |
52 Week Low[Rs]
|
57.28 (01-Jun-23) |
| Nil |
|
|
|
|
|
Nav Graph |
|
|
|
|
|
|
|
|
|
|
|
|
|
|
|
|
Investment Details
|
|
Objective |
| The primary investment objective of the Scheme is seeking to generate long term capital appreciation and provide long term growth opportunities by investing in equity and equity relatedsecurities of companies domiciled in India whose pre-dominant economic activity is in the: a) discovery, development, production, or distribution of natural resources, viz., energy, mining etc; (b) alternative energy and energy technology sectors, with emphasis given to renewable energy, automotive and on-site power generation, energy storage and enabling energy technologies.The Scheme will also invest a certain portion of its corpus in the equity and equity related securitiesof companies domiciled overseas, which are principally engaged in the discovery, development, production or distribution of natural resources and alternative energy and/or the units/ shares of BlackRock Global Funds - Sustainable Energy Fund, BlackRock Global Funds - World Energy Fund and similar other overseas mutual fund schemes. The secondary objective is to generate consistent returns by investing in debt and money market securities. |
|
|
|
|
|
Min. Investment(Rs.)
|
100 |
|
Increm.Investment(Rs.)
|
100 |
|
|
|
Investment Pattern |
| Type | Minimum % | Maximum % | | Equity | 65 | 100 | | Foreign Equity | 0 | 35 | | MMI | 0 | 20 | | Others | 0 | 20 | | Debt | 0 | 20 |
|
|
|
|
|
SIP Details |
|
|
|
SIP MIN Investments(Rs.) |
100 |
|
SIP Incremental Investments(Rs.) |
1 |
|
SIP Frequency |
Daily |
|
No.of Investments Cheques
|
|
|
|
|
|
|
|
Ratio
|
| |
|
Statistical Ratios |
|
|
|
|
Standard Deviation [%] |
18.0236
|
|
Semi Standard Deviation [%] |
0.3685
|
|
Beta [%] |
0.8946
|
|
Sharpe Ratio [%] |
0.8753
|
|
R-Square [%] |
0.6095
|
|
Expense Ratio [%] |
2.2000
|
|
AVG Ratio [%] |
0.0856
|
|
|
|
|
Other Ratios |
|
|
|
|
Jenson Ratio [%] |
0.0964
|
|
Treynor Ratio [%] |
0.1825
|
|
Turnover Ratio [%] |
0.2900
|
|
FAMA Ratio [%] |
0.0999
|
|
SORTINO Ratio [%] |
0.2027
|
|
|
|

|
What is Standard Deviation?
Standard Deviation is the measure of the deviation in the returns of the portfolio. In Simple Words it tells us how much the return on the fund is deviating from the expected normal return.
|
|
|
What is Jenson's Alpha?
It measures whether the Scheme is generating excess returns over the normal returns.For example, if there are two mutual funds that both have a 12% return, a rational investor will want the fund that is less risky.If the value is positive, then the portfolio is earning excess returns. In other words, a positive value for Jensen's alpha means a fund manager has 'beat the market' w with his or her stock picking skills. The Higher the value the better the performance.
|
|
|
|
|
|
|
Portfolio Analysis
|
|
|
|
Allocations As on
31-Mar-2024
|
|
|
|
Fund Size :
990.34
(Cr.) |
|
|
|
 |
|
 |
|
|
|
Market cap-wise Allocation Style |
|
|
|
Average Mkt Cap (Rs Cr) |
189487.99
|
|
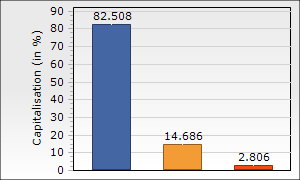
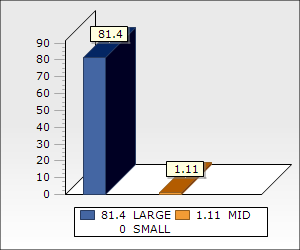
Market Capitalization |
% of Portfolio
|
|
Large |
75.72
|
|
Mid |
1.07
|
|
Small |
NA
|
|
Note: Large-Cap = 5000 Crs. and above, Mid-Cap = 2000 Crs. to 5000 Crs. and
Small-Cap = less than 2000 Crs. |
|
|
|
|
|
|
Portfolio Concentration |
|
|
% Net Assets
|
|
Top 3 Sectors |
48.58 |
|
|
|
+ - Top 5 Holdings |
44.22 |
| Tata Steel | 9.61 | | Coal India | 9.15 | | Hindalco | 8.68 | | Tri-Party Repo (TREP | 8.28 | | Jindal Steel & Power | 7.04 |
|
|
+ - Top 10 Holdings |
72.84 |
| Tata Steel | 9.61 | | Coal India | 9.15 | | Hindalco | 8.68 | | Tri-Party Repo (TREP | 8.28 | | Jindal Steel & Power | 7.04 | | Reliance Industries | 5.37 | | NMDC | 4.92 | | GAIL India | 4.61 | | BPCL | 3.70 | | National Aluminium | 3.62 |
|
|
|
|
|
 Tata Steel Ltd.
|
9.61
|
|
Coal India Ltd.
|
9.15
|
|
Hindalco Industries Ltd.
|
8.68
|
|
BlackRock Global Funds - World Energy Fund ^^
|
8.50
|
 Tri-Party Repo (TREPS)
|
8.28
|
|
Jindal Steel & Power Ltd.
|
7.04
|
|
BlackRock Global Funds - Sustainable Energy Fund ^^
|
6.68
|
|
Reliance Industries Ltd.
|
5.37
|
|
NMDC Ltd.
|
4.92
|
|
GAIL (India) Ltd.
|
4.61
|
|
|
  Indicates an increase or decrease or no change in holding since last portfolio
|
 Indicates a new holding since last portfolio. Indicates a new holding since last portfolio. |
 |
|
|
|
|
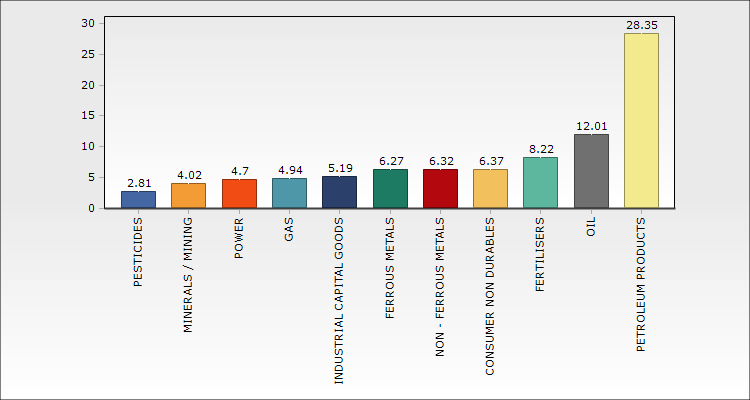
Sector Allocation * (as % of equity portfolio) |
|
|
|
Sector Allocation
Chart Type : |
 |
|
*Pertains to the equity investments only. |
|
|
|
|
|
|
|
|
|
|
In / Out
|
| |
| What's in as on |
|
What's out as on |
| Company Name | Mkt Value | Holdings | | (Rs.Cr) | % | | No Data Found |
|
|
| Company Name | Mkt Value | Holdings | | (Rs.Cr) | % | | No Data Found |
|
|
|
|
|
|
|
|
|
|
|
|
|
|
|

|
|
|